
Track your application performance with real-time metrics — now available in the OutPlane console.
What's included
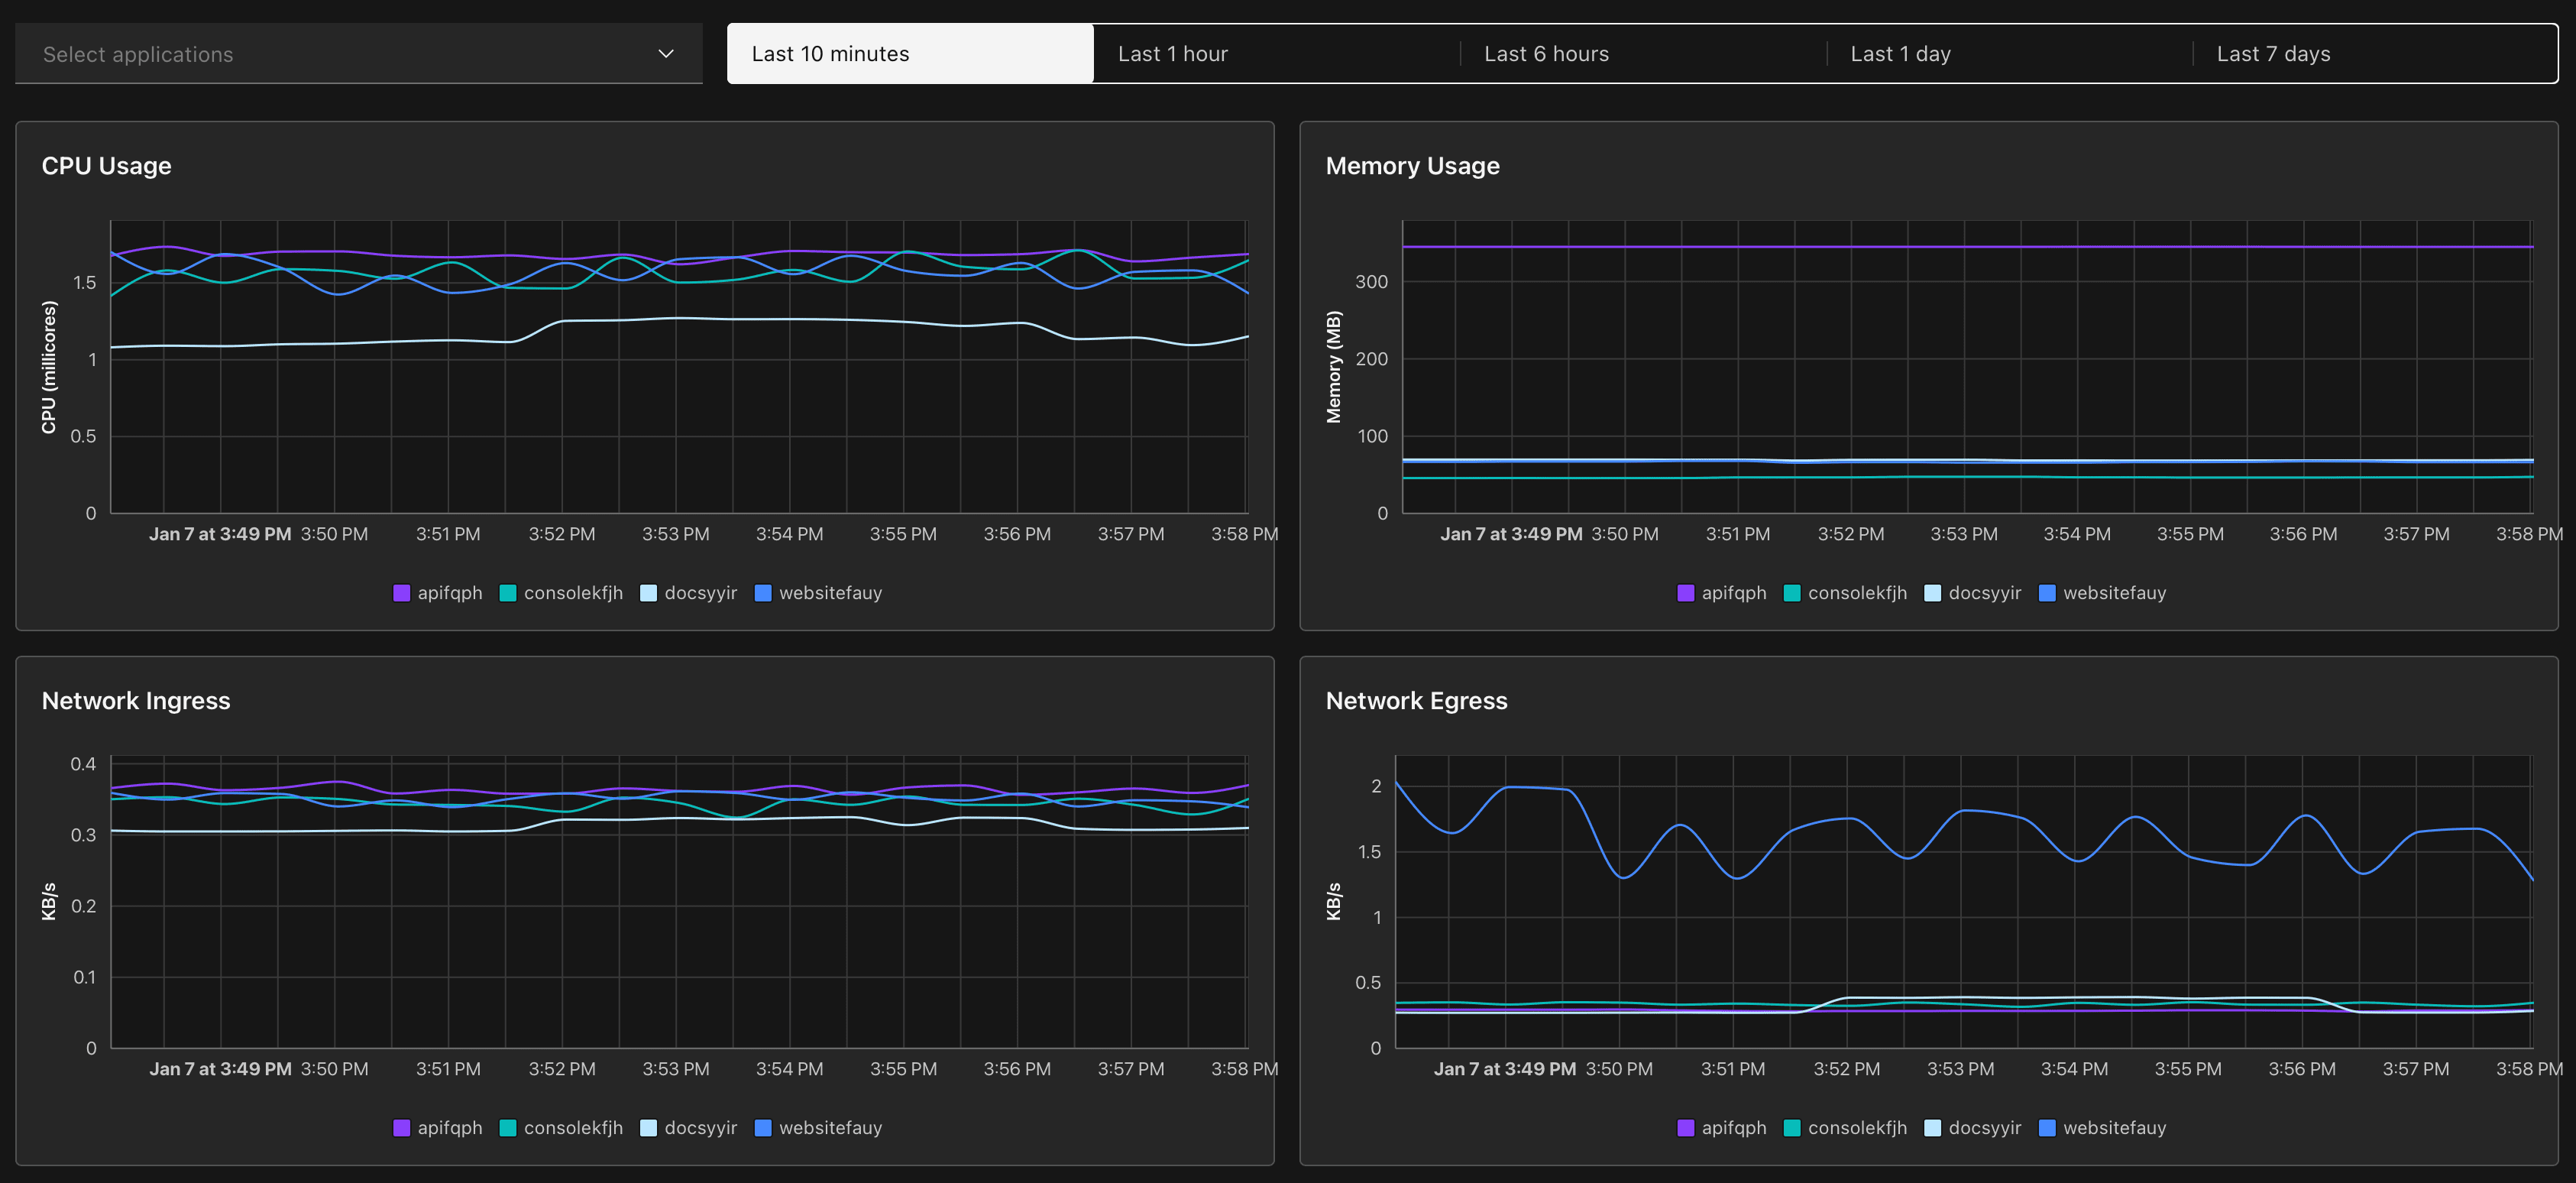
- CPU & Memory monitoring — Visualize resource usage with interactive charts.
- Time range selection — Analyze metrics from the last hour to 7 days.
- Application selector — Switch between your deployed services instantly.
- Responsive charts — Optimized layouts for desktop and mobile viewing.
- API integration — Metrics data powered by our new Metrics API.
Charts available
- CPU utilization over time
- Memory usage trends
- Network Ingress (incoming traffic)
- Network Egress (outgoing traffic)
Getting started
Navigate to Observability > Metrics in your console and select your application to start monitoring.